Clifford Capital Partners Fund
Institutional Class
TICKER: CLIFX
Fund Overview
OBJECTIVE
The investment objective of the Clifford Capital Partners Fund (the “Partners Fund”) is long-term capital appreciation.
HIGHLIGHTS
- Core Value: high returns on capital, sustainable competitive advantages, and strong management teams
- Deep Value: negative market sentiment, defensible franchise value, and high expected return potential
INVESTMENT APPROACH
We use a bottom-up approach that seeks to identify businesses where expectations are irrationally low, leading to significant undervaluation, based on our independent research. Both Core and Deep Value companies exhibit:
- Strong balance sheets
- Market overreaction short-term events
- Key Thesis Points™ (long-term catalysts) that will improve fundamentals
Primarily invests in US Large, Mid, and Small Cap companies at the time of purchase
Concentrated portfolio of 25-35 positions
Quick Look
as of 12/31/2022
Total Assets
(all share classes)
$113mm
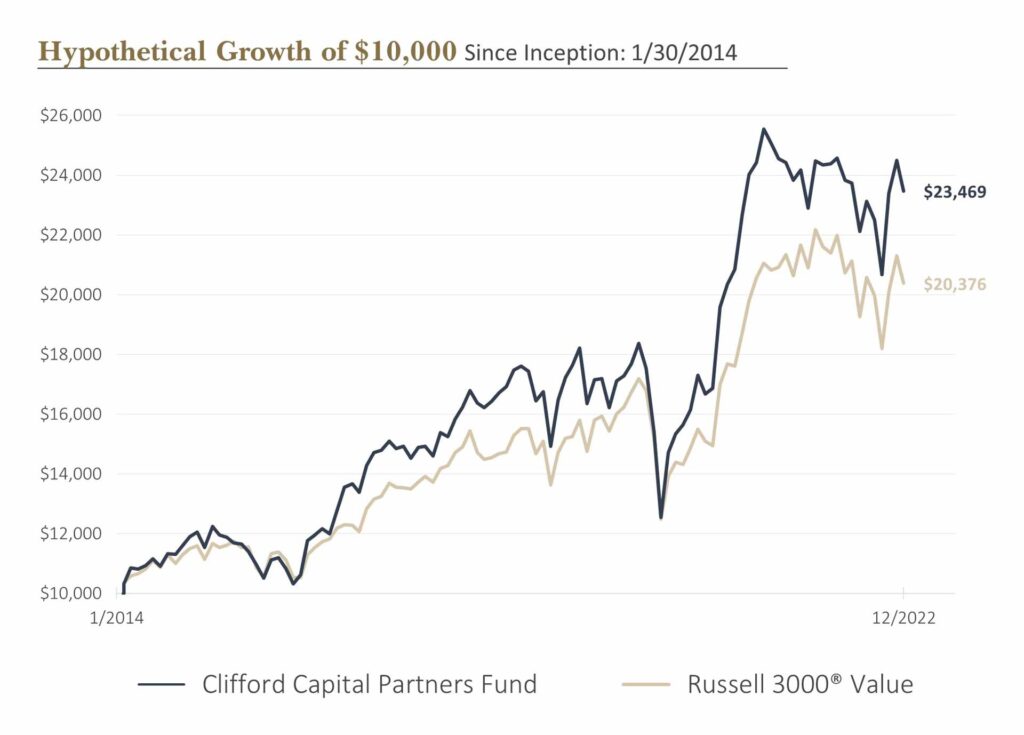
Inception Date
01/30/14
CUSIP
98147A246
Primary Benchmark
Russell 3000 Value Index
Minimum Initial Investment
$100,000
Gross Expense Ratio
1.42%
Net Expense Ratio*
0.90%
Availability
Open
*Clifford Capital Partners, LLC (the Adviser) has contractually agreed to reduce fees and/or reimburse certain fund expenses until January 31, 2024.
Investment Team


Morningstar RatingTM,1
as of 12/31/2022
Overall (out of 393 funds)
Morningstar Category
Mid-Cap Value
The Overall Morningstar Rating, a weighted average of the three-, five-, and ten-year (if applicable) ratings, is out of 393 funds in the Mid-Cap Value category, based on risk-adjusted return as of December 31st, 2022
Documents
©2021 Morningstar. All Right Reserved. The information contained herein: (1) is proprietary to Morningstar and/or its content providers; (2) may not be copied or distributed; and (3) is not warranted to be accurate, complete or timely. Neither Morningstar not its content providers are responsible for any damages or losses arising from any use of this information. Past performance is no guarantee of future results.
1 The Morningstar RatingTM for funds, or “star rating”, is calculated for mutual funds with at least a three-year history. It is calculated based on a Morningstar Risk-Adjusted Return measure that accounts for variation in a fund’s monthly excess performance, placing more emphasis on downward variations and rewarding consistent performance. The top 10% of funds in each product category receive 5 stars, the next 22.5% receive 4 stars, the next 35% receive 3 stars, the next 22.5% receive 2 stars, and the bottom 10% receive 1 star. The Overall Morningstar Rating for a fund is derived from a weighted average of the performance figures associated with its three-, five-, and 10-year (if applicable) Morningstar Rating metrics. The Morningstar rating is for the Institutional Class Only; other classes may have different performance characteristics.
Performance
Average Annual Total Returns
as of 6/30/21

*Returns for periods of less than one year are not annualized.
Current performance may be lower or higher than the data quoted. Investment returns and principal value will fluctuate and shares, when redeemed, may be worth more or less than their original cost. To obtain the Fund’s performance current to the most recent month-end, please call 800.673.0550. A Fund’s performance, especially for short time periods, should not be the sole factor in making an investment decision.
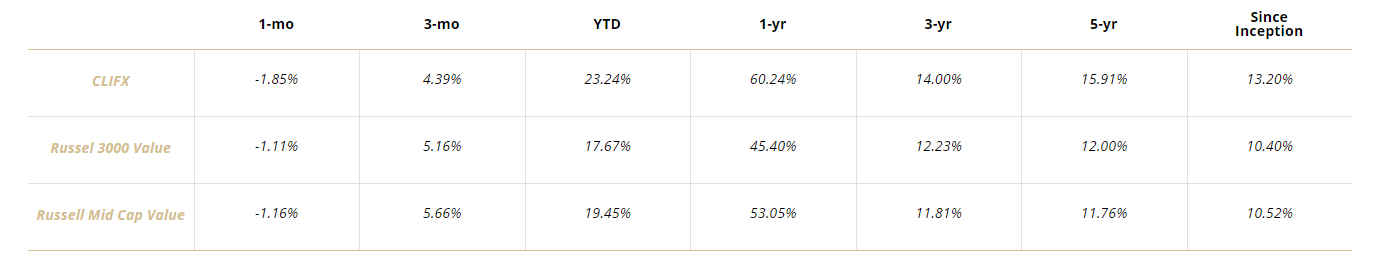
Performance
Average Annual Total Returns
as of 12/31/2022
1-mo
3-mo
YTD
1-yr
3-yr
5-yr
Since
Inception
CLIFX
-4.0%
13.7%
-3.9%
-3.9%
8.5%
7.7%
10.0%
Russel 3000 Value
-4.2%
12.2%
-8.0%
-8.0%
5.9%
6.5%
8.3%
Russell Mid Cap Value
-5.1%
10.4%
-12.1%
-12.1%
5.8%
5.7%
8.0%
*Returns for periods of less than one year are not annualized.
Current performance may be lower or higher than the data quoted. Investment returns and principal value will fluctuate and shares, when redeemed, may be worth more or less than their original cost. To obtain the Fund’s performance current to the most recent month-end, please call 800.673.0550. A Fund’s performance, especially for short time periods, should not be the sole factor in making an investment decision.

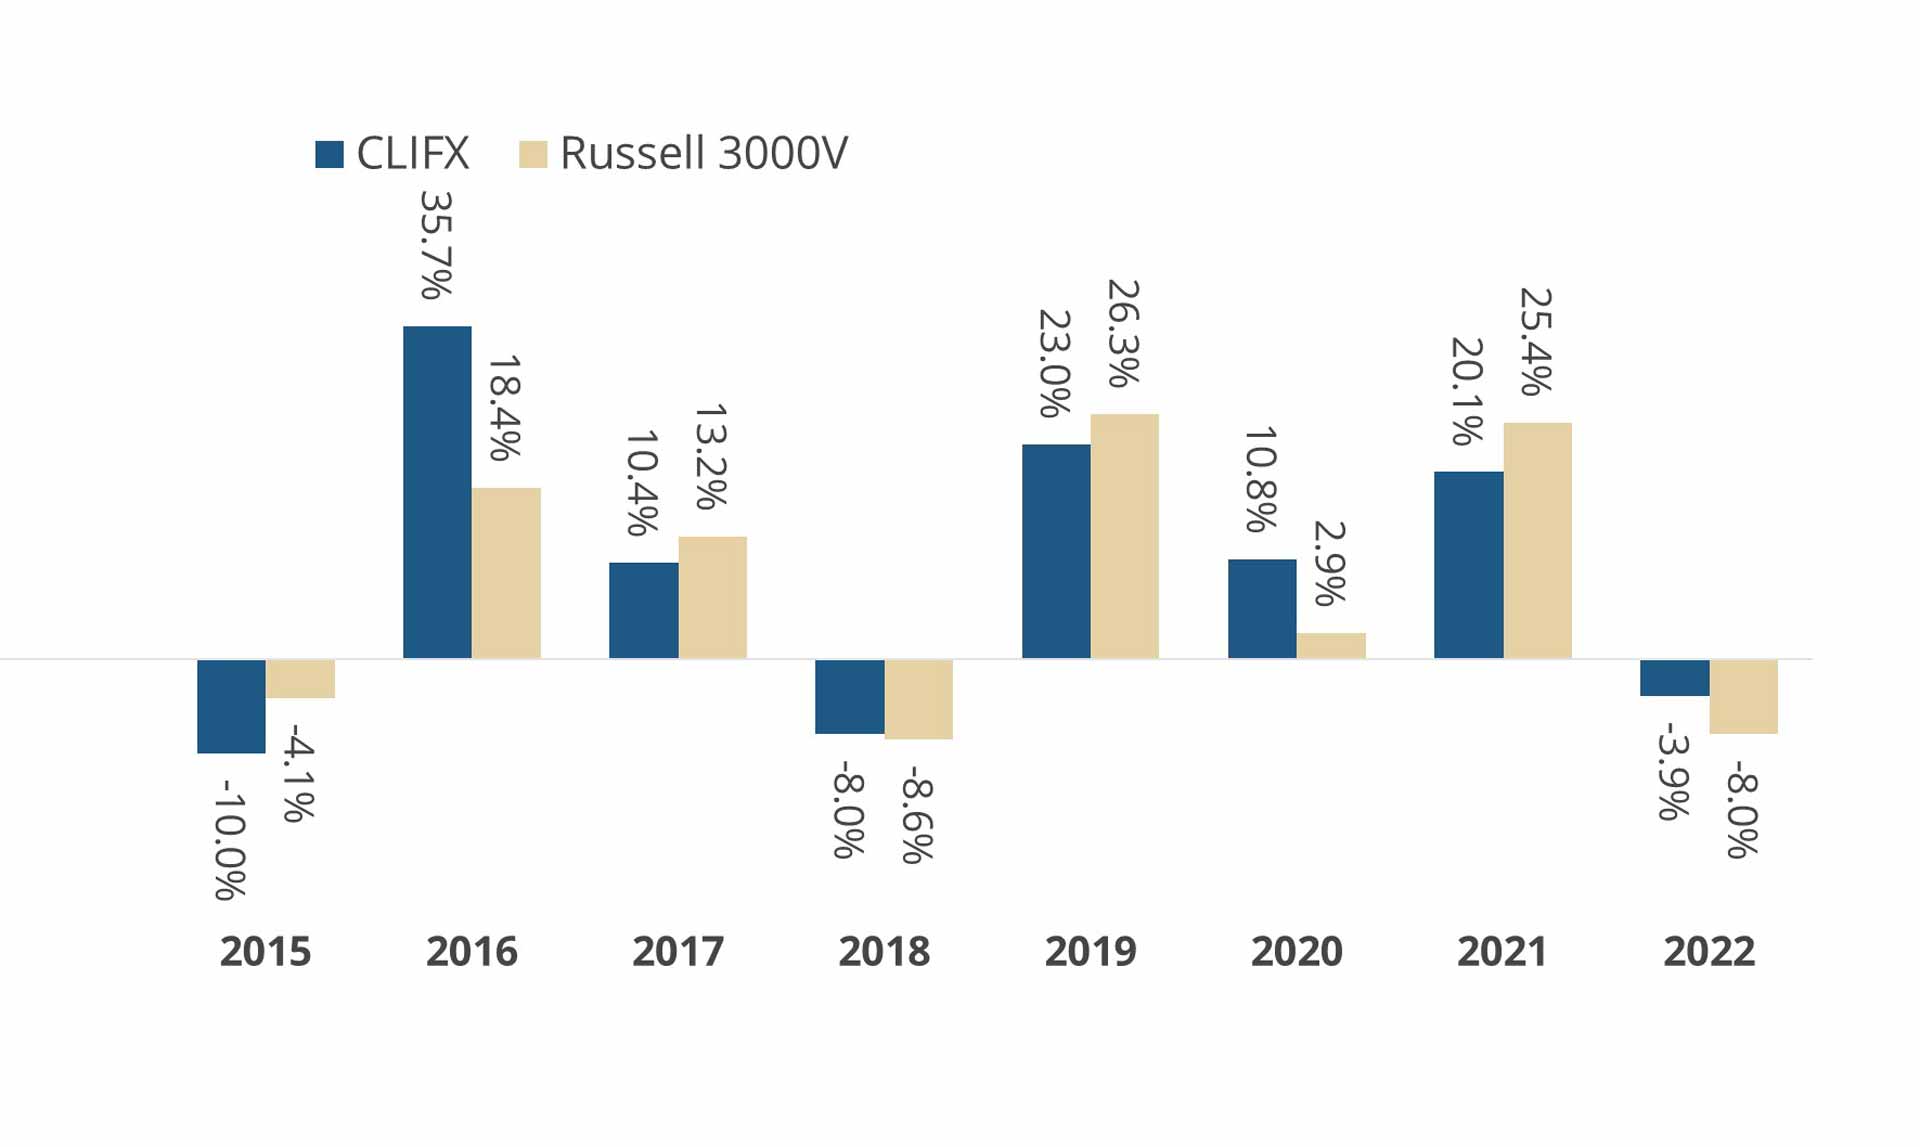
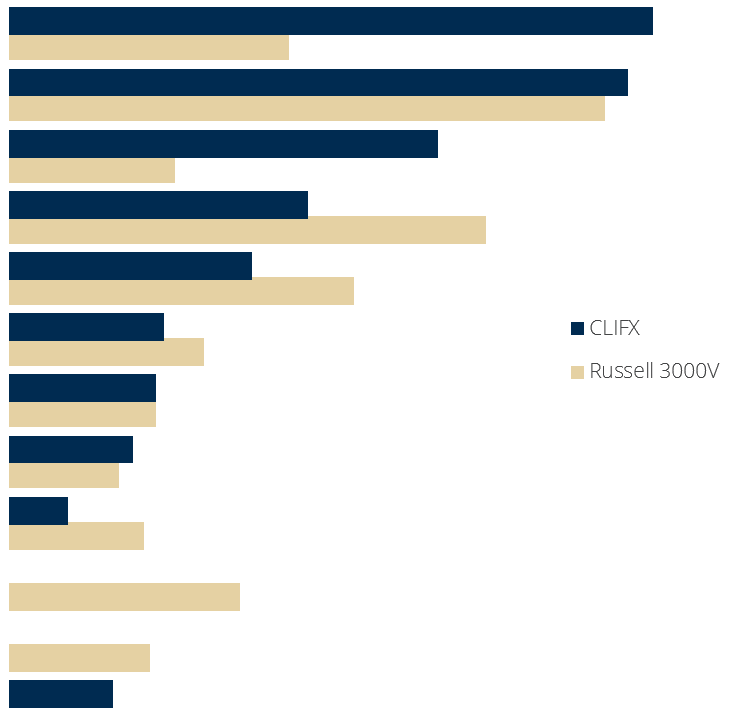
Calendar Year Returns
as of 12/31/22

Characteristics
as of 6/30/21
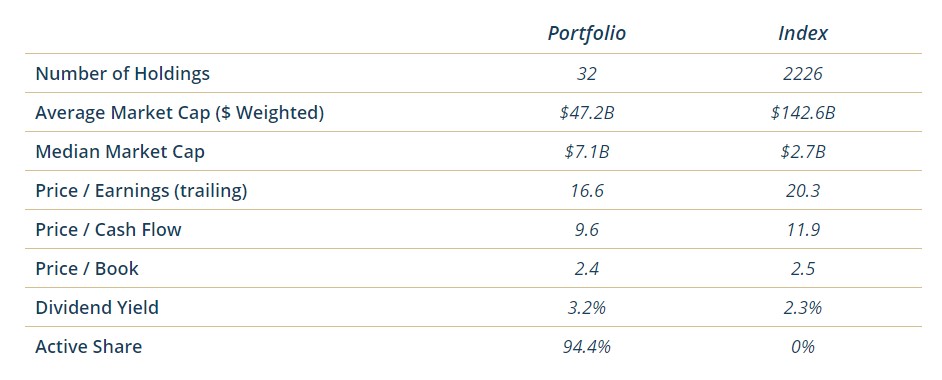
Characteristics
as of 12/31/2022
Portfolio
Index
Number of Holdings
30
2235
Average Market Cap ($ Weighted)
$44.2B
$142.7B
Median Market Cap
$6.7B
$2.0B
Price / Earnings (trailing)
14.1
14.1
Price / Cash Flow
9.1
9.5
Price / Book
2.1
2
Turnover (LTM)
17.3%
n/a
Active Share
94%
0%
Top 10 Holdings
as of 9/30/2022
% of Net Assets
General Mills
5.2%
AutoZone
5.1%
Cardinal Health
5.0%
First Citizens BancShares
4.7%
CVB Financial
4.6%
Change Healthcare
4.3%
First Hawaiian
4.2%
DXC Technology
4.0%
Community Trust Bancorp
3.9%
Kraft Heinz
3.8%
Portfolio holdings exclude cash and short-term investments. Cash represented 3.5% of the total portfolio. Current and future holdings are subject to change and risk. For a complete list of the Fund’s portfolio securities, call 800.673.0550.
Performance Statistics
as of 12/31/2022 – 5 Year
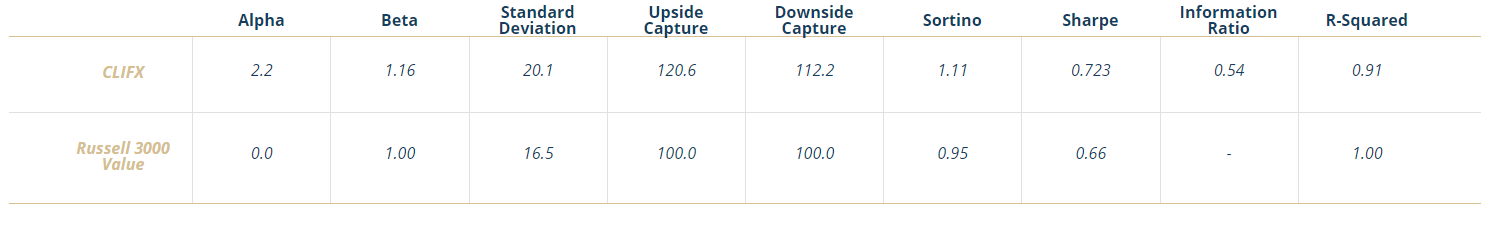
Alpha
Beta
Standard Deviation
Upside
Capture
Downside
Capture
Sortino
Sharpe
Information
Ratio
R-Squared
CLIFX
1.1
1.08
21.6
102.3
98.2
0.43
0.29
0.16
90.50
Russell 3000 Value
0.0
1.00
19.1
100.0
100.0
0.39
0.27
-
1.00
Statistics definitions found in “Important Disclosures Below.”
Sector Allocation
as of 6/30/21
Sector
Portfolio
Index
Information Technology
22.8%
9.9%
Financials
21.9%
21.1%
Consumer Discretionary
15.2%
5.9%
Health Care
10.6%
16.9%
Industrials
8.6%
12.2%
Consumer Staples
5.5%
6.9%
Energy
5.2%
5.2%
Materials
4.4%
3.9%
Utilities
2.1%
4.8%
Communication Services
0.0%
8.2%
Real Estate
0.0%
5.0%
Cash
3.7%
0.0%
Weights are calculated as a percentage of net assets including cash & cash equivalents
Sector Allocation
as of 12/31/2022
Weights are calculated as a percentage of net assets including cash & cash equivalents. Sector information is based on a representative account as of the date shown and subject to change.
Commentary & Literature

Partners Fund Distributions – Institutional Class
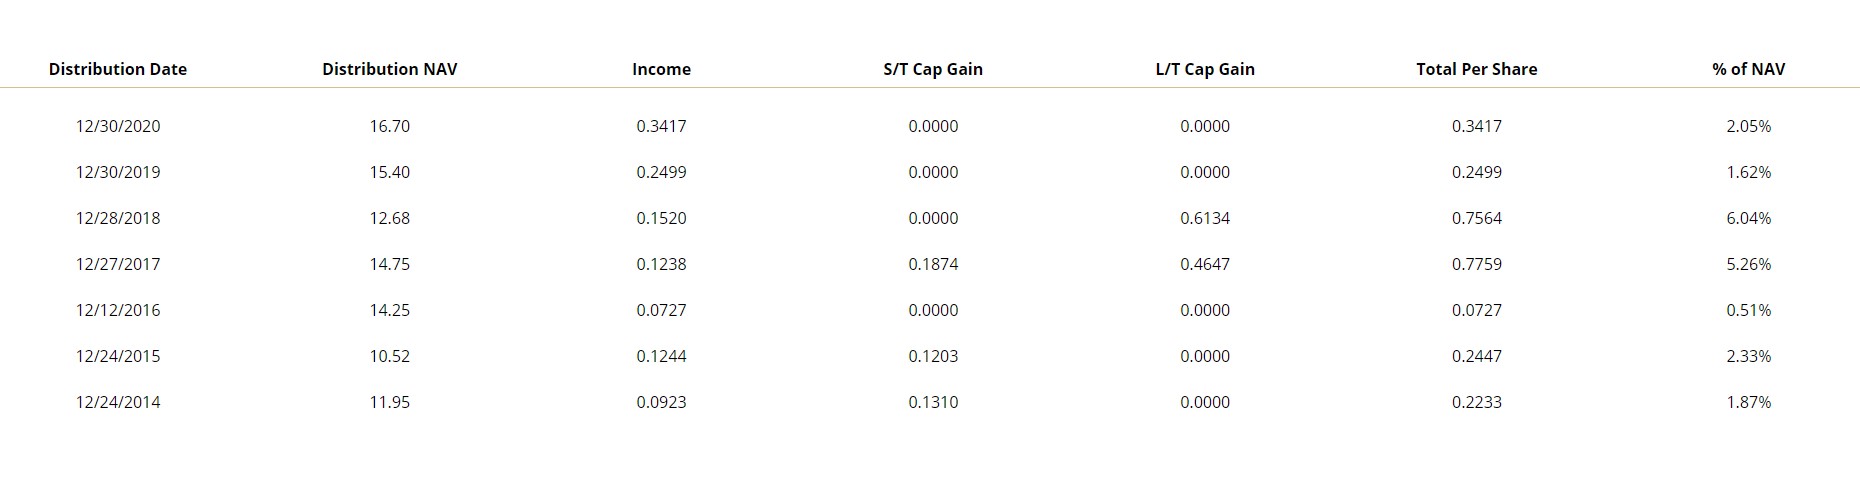
Distribution Date
Distribution NAV
Income
S/T Cap Gain
L/T Cap Gain
Total Per Share
% of NAV
12/30/2022
12/29/2021
12/30/2020
12/30/2019
12/28/2018
12/27/2017
12/12/2016
12/24/2015
12/24/2014
18.18
19.32
16.70
15.40
12.68
14.75
14.25
10.52
11.95
0.1988
0.2945
0.3417
0.2499
0.1520
0.1238
0.0727
0.1244
0.0923
0.1113
0.3013
0.0000
0.0000
0.0000
0.1874
0.0000
0.1203
0.1310
0.0609
0.2396
0.0000
0.0000
0.6134
0.4647
0.0000
0.0000
0.0000
0.3710
0.8354
0.3417
0.2499
0.7564
0.7759
0.0727
0.2447
0.2233
2.04%
4.32%
2.05%
1.62%
6.04%
5.26%
0.51%
2.33%
1.87%
Important Disclosures
For more complete information, please download the fund’s prospectus or call 800.673.0550 for copies. You should consider the fund’s investment objectives, risks, charges, and expenses carefully before you invest. Information about these and other important subjects is in the fund’s prospectus which you should read carefully before investing.