All Cap Value Strategy
Strategy Overview
HIGHLIGHTS
The blend of Core and Deep Value companies provides alpha potential with a less volatile return stream compared to Deep Value only investors
- Core Value: highest quality, strong return profiles, sustainable competitive advantages, and strong management teams
- Deep Value: negative market sentiment, defensible franchise value, and high expected return potential
INVESTMENT APPROACH
- Strong balance sheets
- Market overreaction short-term events
- Key Thesis Points™ (long-term catalysts) that will improve fundamentals
Primarily invests in a combination of US Large Cap, Mid Cap and Small Cap Value companies.
Concentrated portfolio of 25-35 positions
Quick Look
as of 12/31/2022
Total Assets
Mutual Fund
$113mm
Separate Accounts
$215mm
Model Delivery
$276mm
Total
$604mm
Inception Date
08/01/10
Separate Account Minimum
$5mm
Primary Benchmark
Russell 3000 Value Index
Documents

Investment Team


Performance
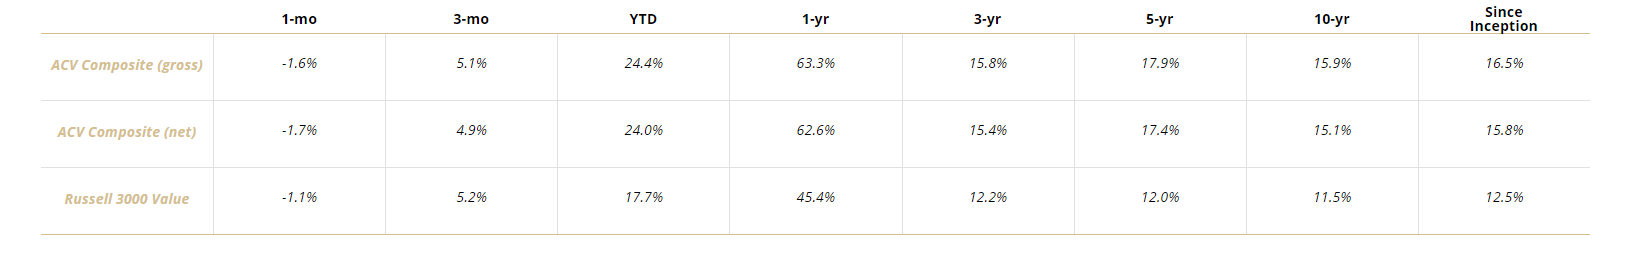
as of 12/31/2022
1-mo
3-mo
YTD
1-yr
3-yr
5-yr
10-yr
Since
Inception
ACV Composite (gross)
-3.9%
14.1%
-3.0%
-3.0%
10.2%
9.1%
13.2%
13.9%
ACV Composite (net)
-3.9%
13.9%
-3.6%
-3.6%
9.7%
8.6%
12.6%
13.2%
Russell 3000 Value
-4.2%
12.2%
-8.0%
-8.0%
5.9%
6.5%
10.3%
10.7%
*Returns for periods less than one year are not annualized
Performance
as of 6/30/21
*Returns for periods less than one year are not annualized
Calendar Year Returns
as of 12/31/2022
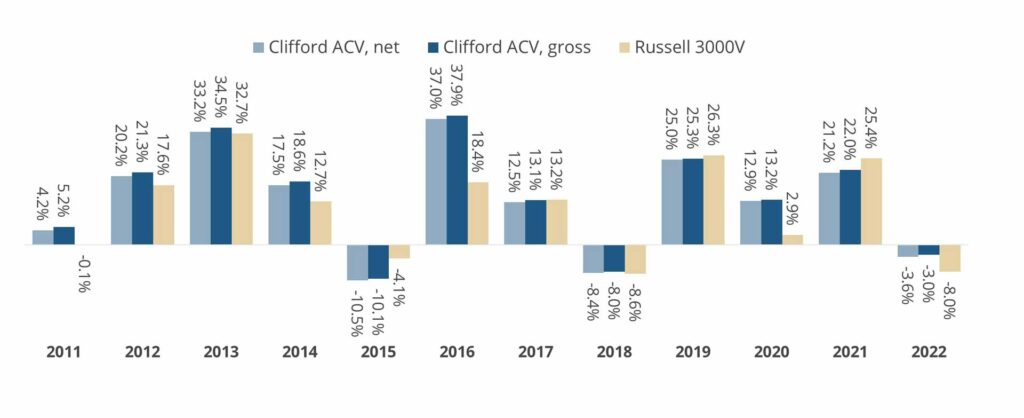

Clifford All Cap Value Portfolio
since inception
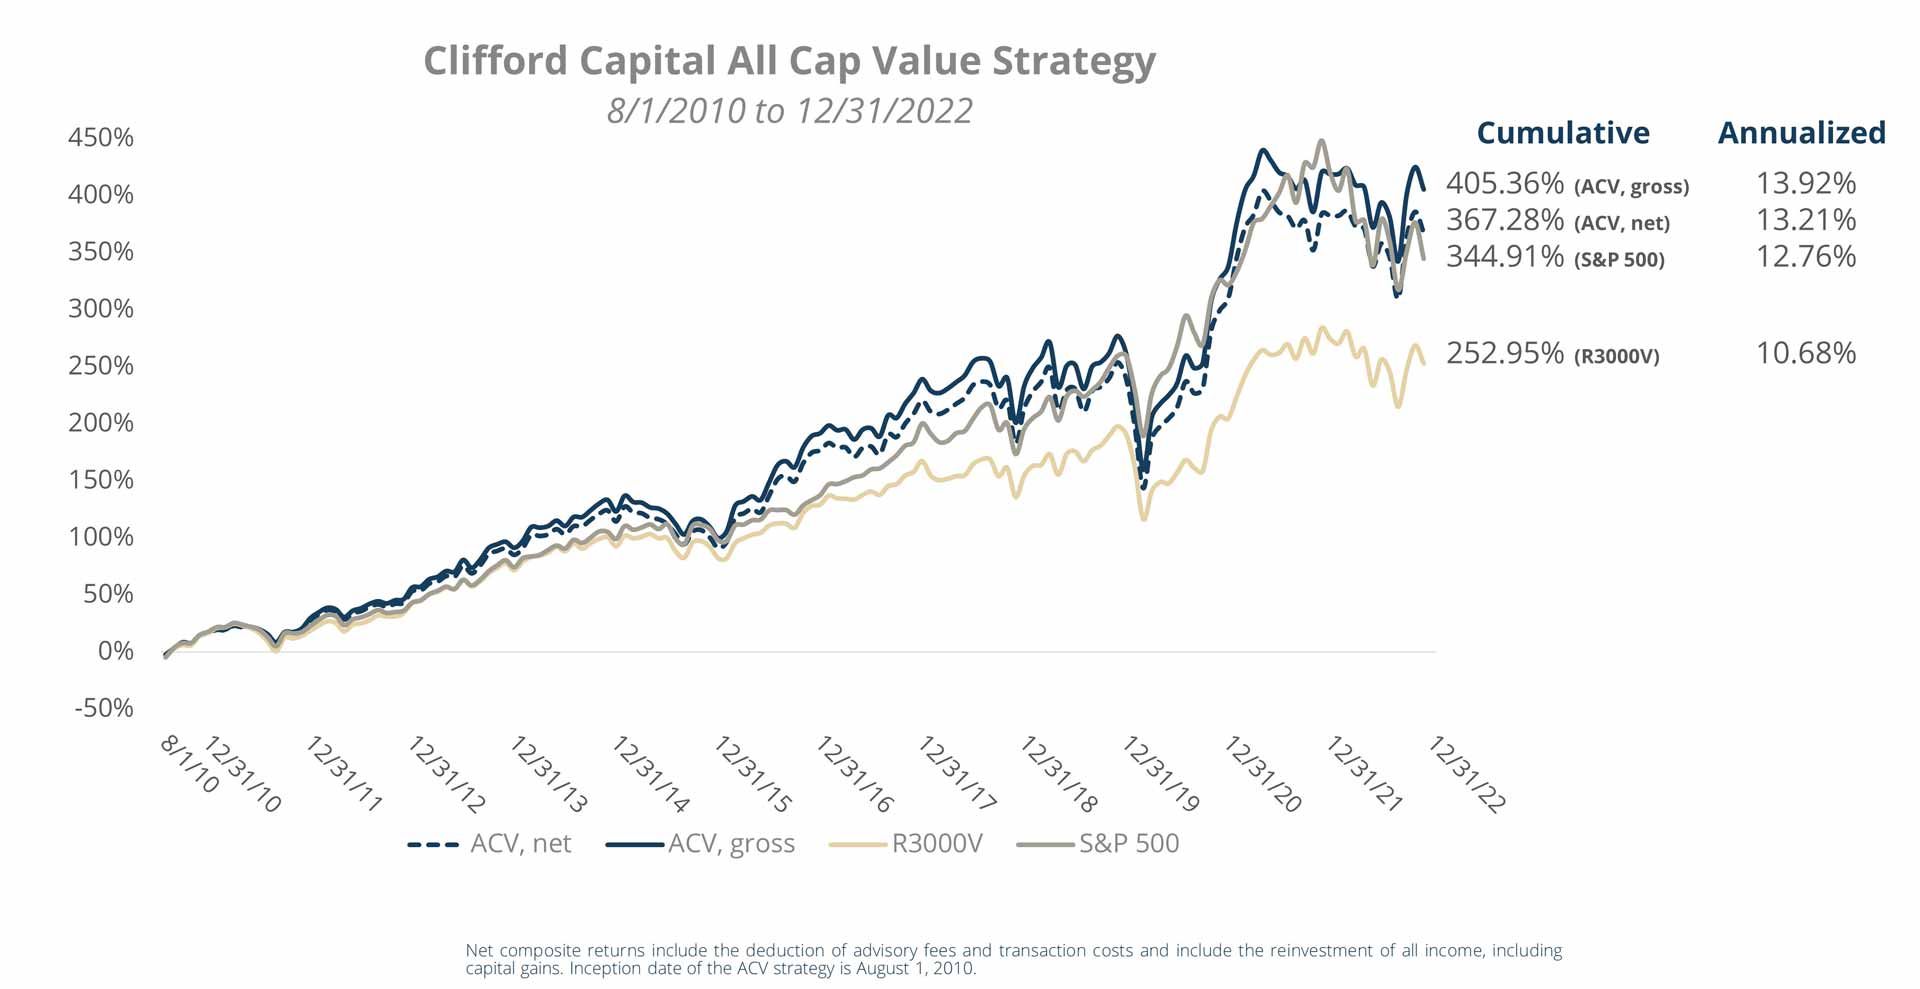
Portfolio performance and statistics presented are the results of the Clifford Capital All Cap Value (“ACV”) composite. The ACV Composite combines high-quality (Core Value) stock investments, opportunistic (Deep Value) stock investments and cash. The ACV strategy offers exposure to US Value equities across the full capitalization spectrum from small cap to large cap. The inception date for the ACV Composite is August 1, 2010. Composite returns are shown after the deduction of transaction costs and include the reinvestment of all income including capital gains. Net of fees returns are calculated after the deduction of the actual advisory fees paid by clients. Gross of fees returns do not reflect the deduction of advisory fees. A client’s returns will be reduced by investment advisory fees and other expenses that may be incurred during account management.
The ACV Composite’s benchmark is the Russell 3000® Value Index, which measures the performance of the broad value segment of the U.S. equity value universe. The benchmark may have different composition, volatility, risk, investment philosophy, holding times, and/or other investment-related factors than the Composite. Therefore, an investor’s individual results may vary significantly from the benchmark’s performance. An index is unmanaged, does not incur fees or expenses, and cannot be invested in directly. Past performance is not indicative of future returns.

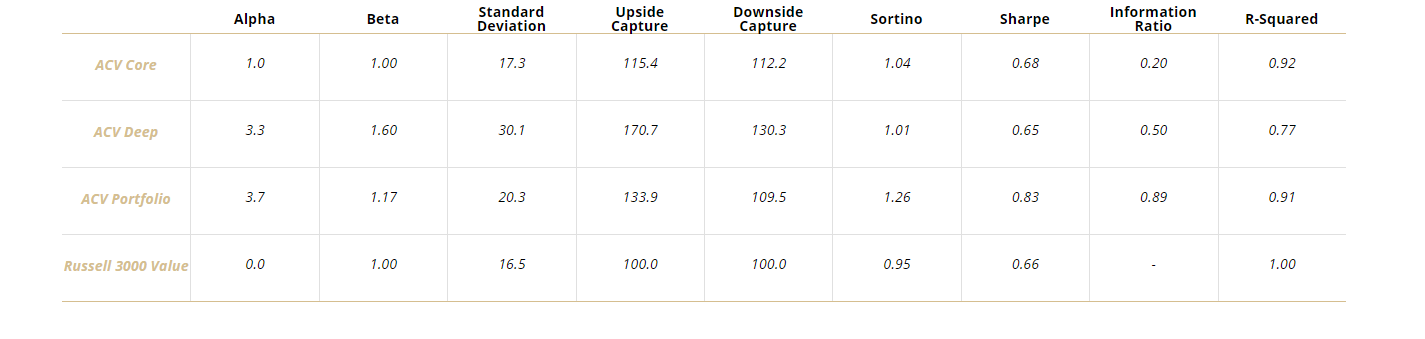
Performance Statistics
as of 12/31/2022 – 5 Year
Alpha
Beta
Standard Deviation
Upside
Capture
Downside
Capture
Sortino
Sharpe
Information
Ratio
R-Squared
ACV Core
4.2
0.92
18.6
100.9
88.6
0.75
0.49
0.59
0.89
ACV Deep
-3.5
1.46
31.2
123.6
124.2
0.10
0.07
-0.18
0.80
ACV Portfolio
2.2
1.08
21.8
107.8
97.9
0.54
0.36
0.37
0.91
Russell 3000 Value
0.0
1.00
19.1
100.0
100.0
0.39
0.27
-
1.00
Statistics definitions found in “Important Disclosures Below.”
Characteristics
as of 6/30/21

Characteristics
as of 12/31/2022
ACV
R3000V
Number of Holdings
30
2235
Average Market Cap ($ Weighted)
$44.2B
$142.7B
Median Market Cap
$6.7B
$2.0B
Price / Earnings (trailing)
15.7
14.1
Price / Cash Flow
9.1
9.5
Price / Book
2.1
2.0
Turnover (LTM)
11.2%
n/a
Active Share
94%
0%
Top 10 Holdings
as of 9/30/2022
% of Net Assets
General Mills
5.3%
AutoZone
5.2%
Cardinal Health
5.1%
First Citizens BancShares
4.7%
CVB Financial
4.7%
Change Healthcare
4.4%
First Hawaiian
4.3%
DXC Technology
4.1%
Community Trust Bancorp
4.0%
Kraft Heinz
3.8%
Top Ten Holdings only shows securities held and does not include any cash or cash equivalent positions in the portfolio. The holdings information presented is based on a representative portfolio and should not be considered a recommendation to purchase or sell any security. There is no assurance that any securities presented herein will remain in the portfolio at the time you receive information or that securities sold have not been repurchased. It should not be assumed that any securities transactions or holdings presented were or will prove to be profitable, or that the investment recommendations or decisions we make in the future will be profitable or will equal the investment performance of the securities presented herein. Other portfolios will vary in composition, characteristics, and will experience different investment results.
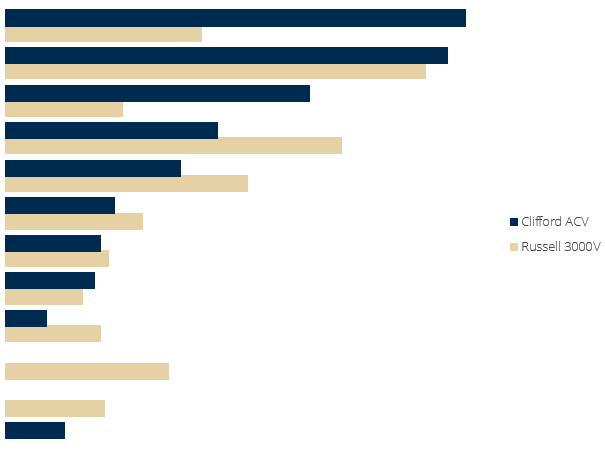
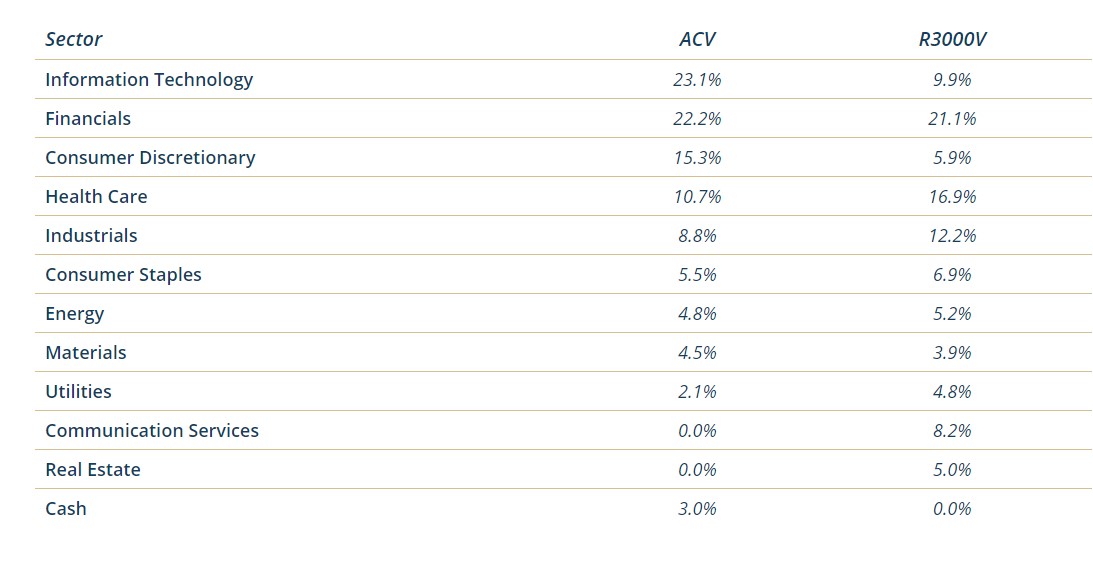
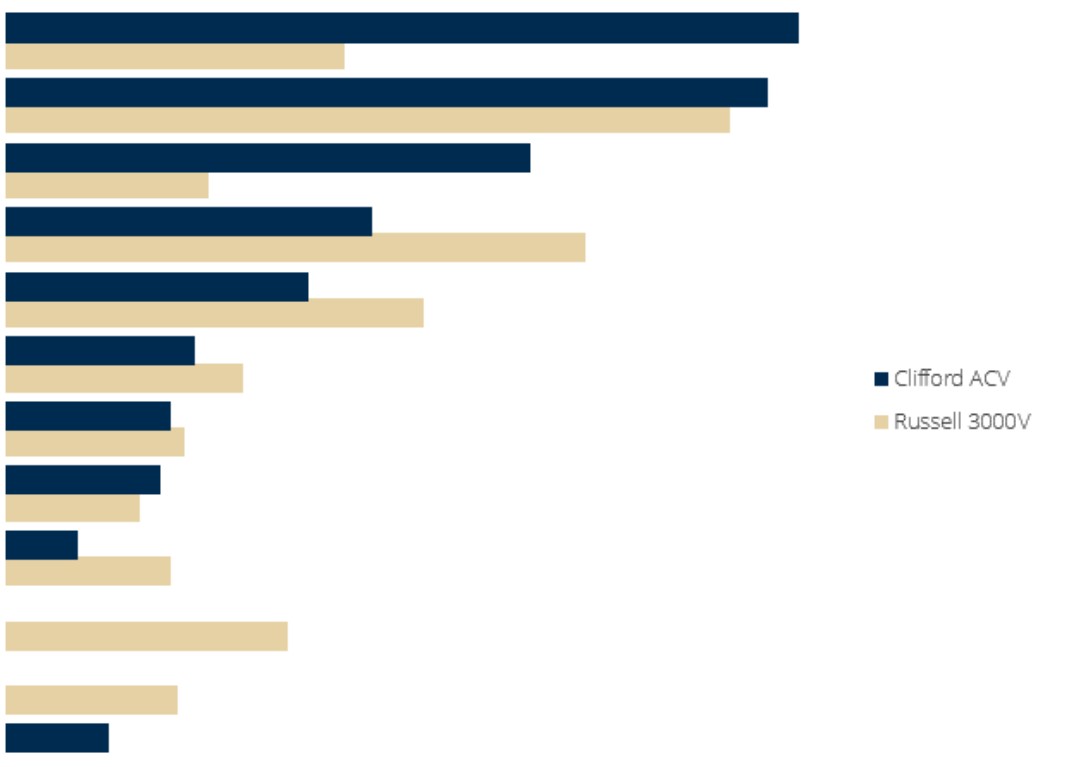
Sector Allocation
as of 6/30/21
Sector
ACV
R3000V
Information Technology
23.1%
9.9%
Financials
22.2%
21.1%
Consumer Discretionary
15.3%
5.9%
Health Care
10.7%
16.9%
Industrials
8.8%
12.2%
Consumer Staples
5.5%
6.9%
Energy
4.8%
5.2%
Materials
4.5%
3.9%
Utilities
2.1%
4.8%
Communication Services
0.0%
8.2%
Real Estate
0.0%
5.0%
Cash
3.0%
0.0%
Sector Allocation
as of 12/31/2022
Weights are calculated as a percentage of net assets including cash & cash equivalents. Sector information is based on a representative account as of the date shown and subject to change.
Market Cap Trend
as of 12/31/2022
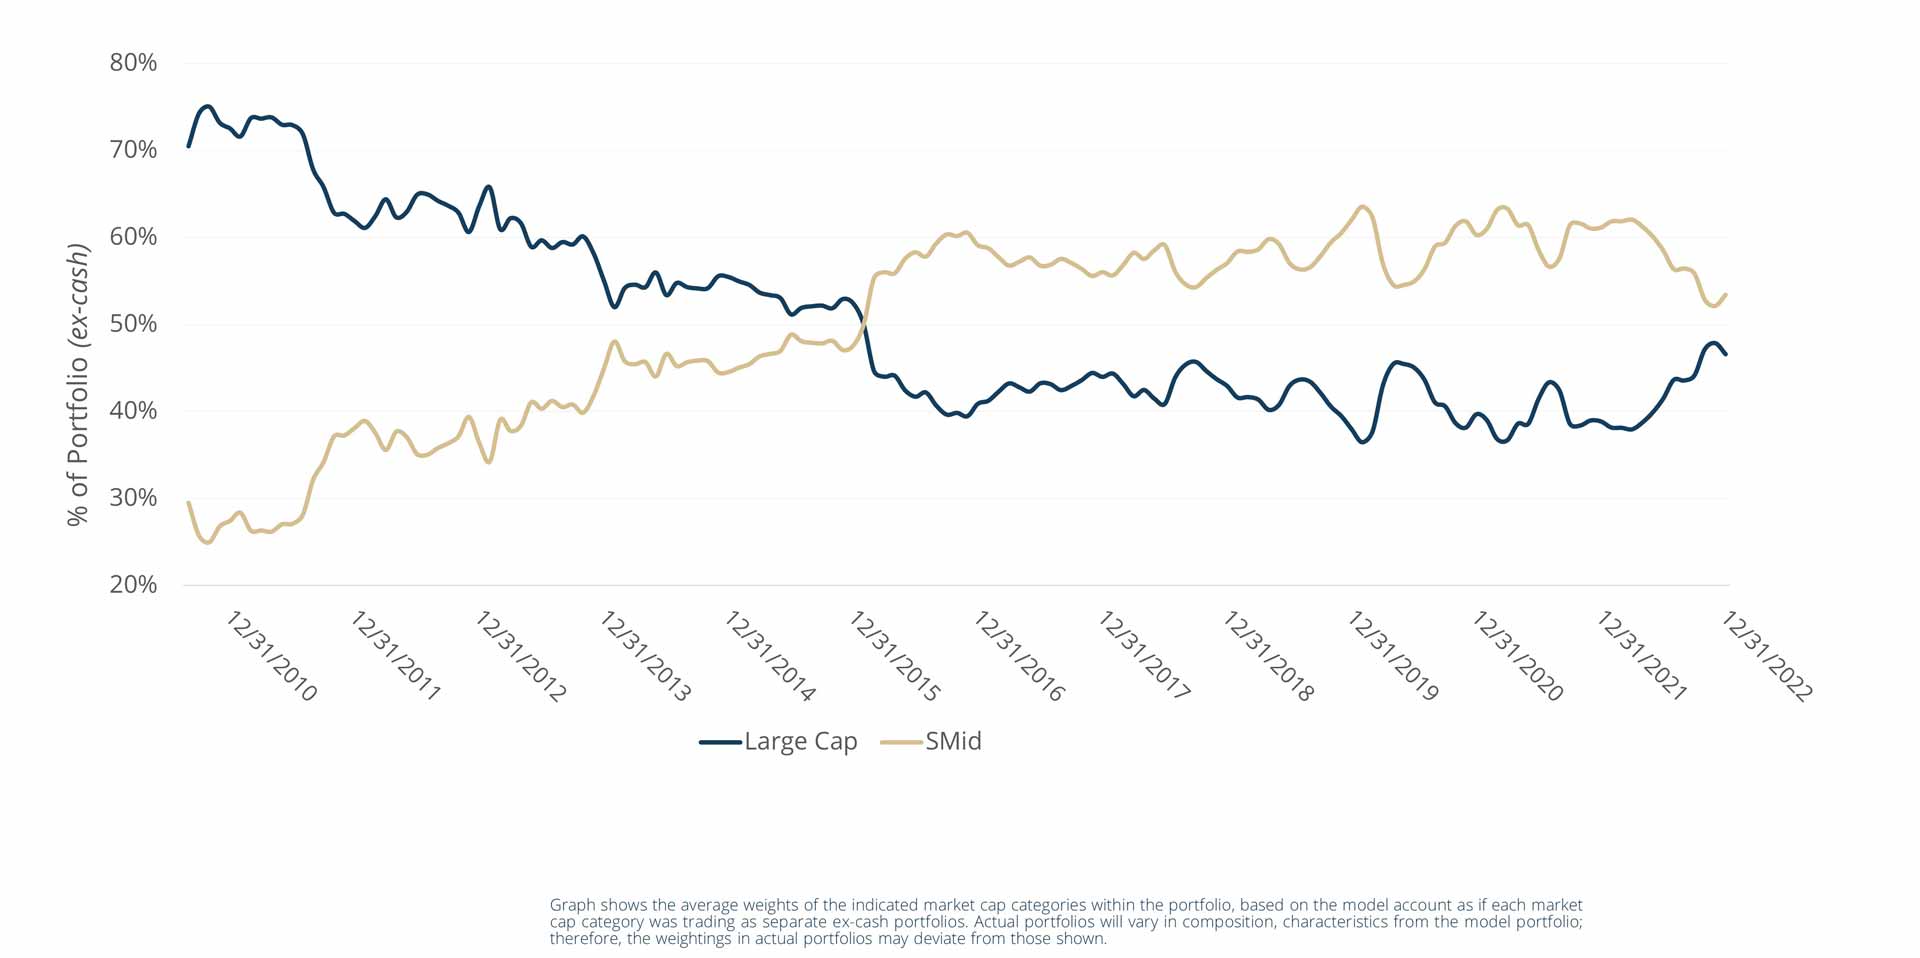
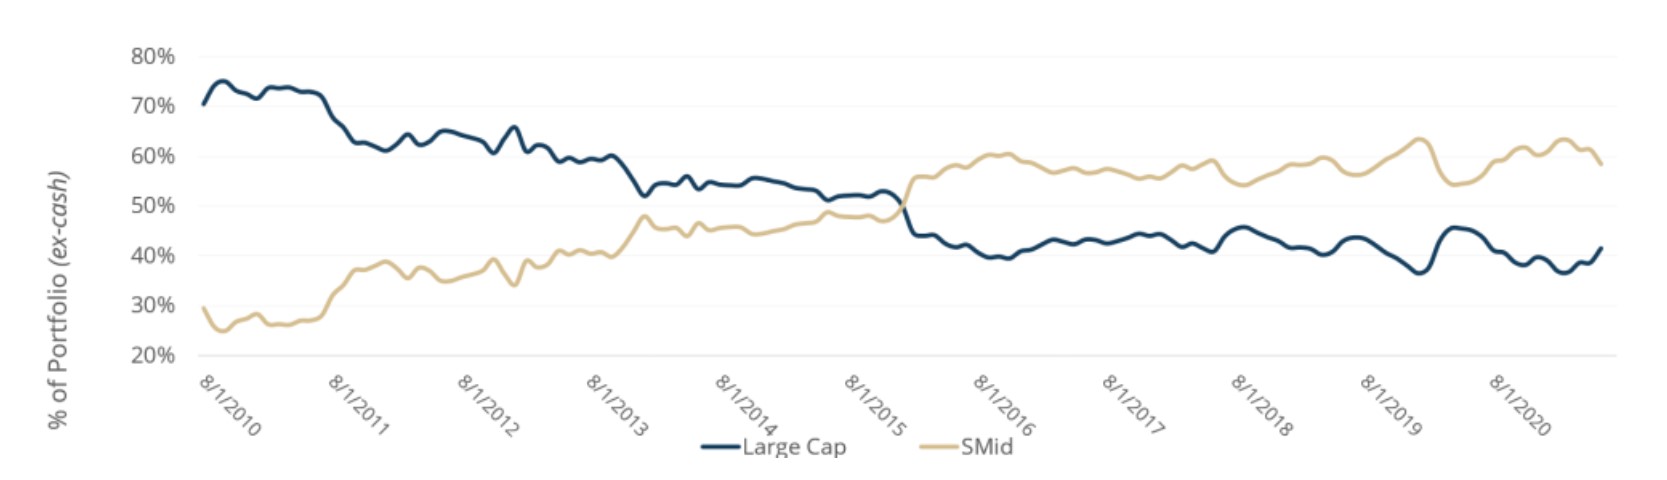
Graph shows the average weights of the indicated market cap categories within the portfolio, based on the model account as if each market cap category was trading as separate ex-cash portfolios. Actual portfolios will vary in composition, characteristics from the model portfolio; therefore, the weightings in actual portfolios may deviate from those shown.
Large Cap defined as companies with $15 billion. SMID (small and mid-cap) companies have a market cap of less than $15 billion (Mid-cap $4B-15B, Small < $4B).
