Focused Small Cap Value Fund
Institutional Class
TICKER: FSVVX
Fund Overview
OBJECTIVE
The investment objective of the Focused Small Cap Value Fund is long-term capital appreciation.
HIGHLIGHTS
The blend of Core Value and Deep Value companies provides alpha potential with less volatility than a pure deep value strategy
- Core Value: high returns on capital, sustainable competitive advantages, and strong management teams
- Deep Value: negative market sentiment, defensible franchise value, and high expected return potential
INVESTMENT APPROACH
We use a bottom-up approach that seeks to identify businesses where expectations are irrationally low, leading to significant undervaluation, based on our independent research. Both Core Value and Deep Value companies exhibit:
- Strong balance sheets
- Market overreaction short-term events
- Key Thesis Points™ (long-term catalysts) that will improve fundamentals
Primarily invests in companies with market caps of less than $4 billion at the time of purchase.
Concentrated portfolio of 25-35 positions
Quick Look
Total Assets
(all share classes)
$11mm
as of 12/31/2022
Inception Date
10/01/19
CUSIP
98148K128
Primary Benchmark
Russell 2000 Value Index
Minimum Initial Investment
$100,000
Gross Expense Ratio
3.01%
Net Expense Ratio*
1.05%
Availability
Open
*Clifford Capital Partners, LLC (the Adviser) has contractually agreed to reduce fees and/or reimburse certain fund expenses until January 31, 2024.
Investment Team


Morningstar RatingTM,1
as of 12/31/2022
Overall (out of 453 funds)
Morningstar Category Small Cap Value
The Overall Morningstar Rating, a weighted average of the three-, five-, and ten-year (if applicable) ratings, is out of 403 funds in the Small-Cap Value category, based on risk-adjusted return as of December 31st, 2022.
Documents
Performance
Average Annual Total Returns
as of 6/30/21
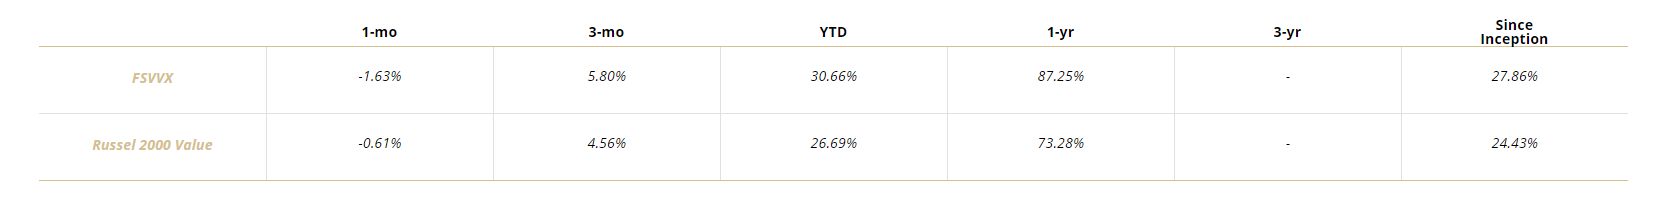
*Returns for periods of less than one year are not annualized.
Current performance may be lower or higher than the data quoted. Investment returns and principal value will fluctuate and shares, when redeemed, may be worth more or less than their original cost. To obtain the Fund’s performance current to the most recent month-end, please call 800.673.0550. A Fund’s performance, especially for short time periods, should not be the sole factor in making an investment decision.
Performance
Average Annual Total Returns
as of 12/31/2022
1-mo
3-mo
YTD
1-yr
3-yr
Since
Inception
FSVVX
-6.7%
14.7%
-11.4%
5.8%
-
74%
Russel 2000 Value
-6.6%
8.4%
-14.5%
4.7%
-
7.6%
*Returns for periods of less than one year are not annualized.
Current performance may be lower or higher than the data quoted. Investment returns and principal value will fluctuate and shares, when redeemed, may be worth more or less than their original cost. To obtain the Fund’s performance current to the most recent month-end, please call 800.673.0550. A Fund’s performance, especially for short time periods, should not be the sole factor in making an investment decision.
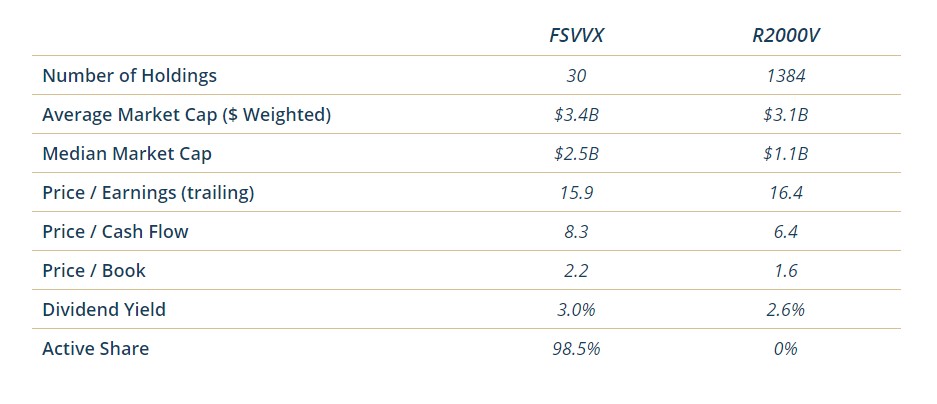
Characteristics
as of 6/30/21
Characteristics
as of 12/31/2022
FSVVX
R2000V
Number of Holdings
30
1383
Average Market Cap ($ Weighted)
$2.2B
$2.4B
Median Market Cap
$1.3B
$0.8B
Price / Earnings (trailing)
12.5
10.1
Price / Cash Flow
7.5
6.0
Price / Book
1.5
0.8
Turnover (LTM)
56.6%
n/a
Active Share
99%
0%
Top 10 Holdings
as of 9/30/2022
% of Net Assets
CVB Financial
4.8%
Winmark
4.6%
NextGen Healthcare
4.6%
Community Trust Bancorp
4.6%
Westamerica Bancorp
4.2%
First Hawaiian
4.0%
Hancock Whitney
3.9%
Perdoceo Education Corp.
3.7%
DXC Technology
3.7%
EVERTEC
3.5%
Portfolio holdings exclude cash and short-term investments. Cash represented 3.5% of the total portfolio. Current and future holdings are subject to change and risk. For a complete list of the Fund’s portfolio securities, call 800.673.0550.
Sector Allocation
as of 6/30/21
Sector
FSVVX
R2000V
Financials
22.7%
25.3%
Information Technology
16.5%
5.5%
Consumer Discretionary
15.6%
8.3%
Industrials
14.9%
15.2%
Materials
7.3%
4.7%
Health Care
6.0%
11.4%
Consumer Staples
4.8%
4.5%
Communication Services
2.9%
2.8%
Energy
2.1%
6.6%
Real Estate
0.0%
11.1%
Utilities
0.0%
4.6%
Cash
7.2%
0.0%
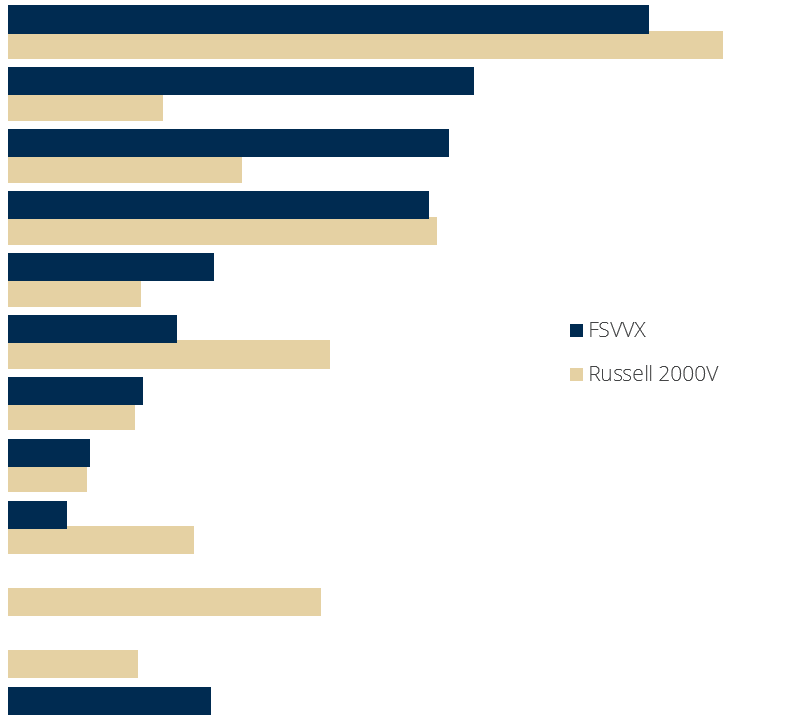
Weights are calculated as a percentage of net assets including cash & cash equivalents
Sector Allocation
as of 12/31/2022
Weights are calculated as a percentage of net assets including cash & cash equivalents. Sector information is based on a representative account as of the date shown and subject to change.
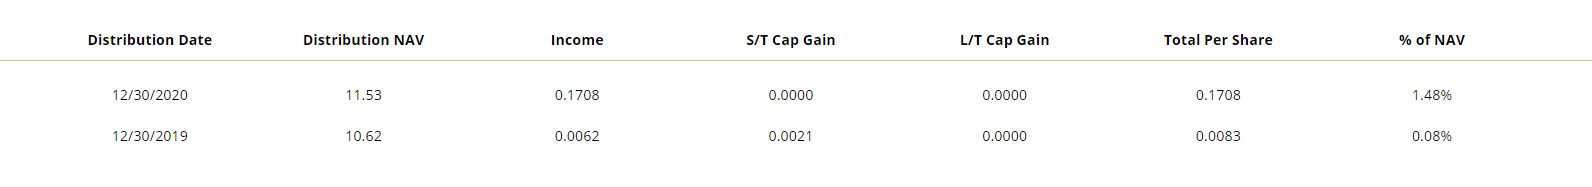
Commentary & Literature

Focused Small Cap Value Mutual Fund Distributions – Institutional Class
Distribution Date
Distribution NAV
Income
S/T Cap Gain
L/T Cap Gain
Total Per Share
% of NAV
12/30/2022
12/29/2021
12/30/2020
12/30/2019
10.45
12.43
11.53
10.62
0.0396
0.1249
0.1708
0.0062
0.0000
1.0702
0.0000
0.0021
0.5429
0.3690
0.0000
0.0000
0.5825
1.5641
0.1708
0.0083
5.57%
12.58%
1.48%
0.08%
Important Disclosures
For more complete information, please download the fund’s prospectus or call 800.673.0550 for copies. You should consider the fund’s investment objectives, risks, charges, and expenses carefully before you invest. Information about these and other important subjects is in the fund’s prospectus which you should read carefully before investing.
