Focused Small Cap Value Strategy
Strategy Overview
HIGHLIGHTS
The blend of Core and Deep Value companies provides alpha potential with a less volatile return stream compared to Deep Value only investors
- Core Value: highest quality, strong return profiles, sustainable competitive advantages, and strong management teams
- Deep Value: negative market sentiment, defensible franchise value, and high expected return potential
INVESTMENT APPROACH
We use a bottom-up approach that seeks to identify businesses where expectations are irrationally low, leading to significant undervaluation, based on our independent research. Both Core and Deep Value companies exhibit:
- Strong balance sheets
- Market overreaction short-term events
- Key Thesis Points™ (long-term catalysts) that will improve fundamentals
Primarily invests in companies with market caps of less than $4 billion at the time of purchase
Concentrated portfolio of 25-35 positions
Quick Look
as of 12/31/2022
Total Assets
Mutual Fund
$11mm
Model Delivery
$27mm
Total
$40mm
Inception Date
04/01/16
Separate Account Minimum
$2mm
Primary Benchmark
Russell 2000 Value Index
Documents

Investment Team


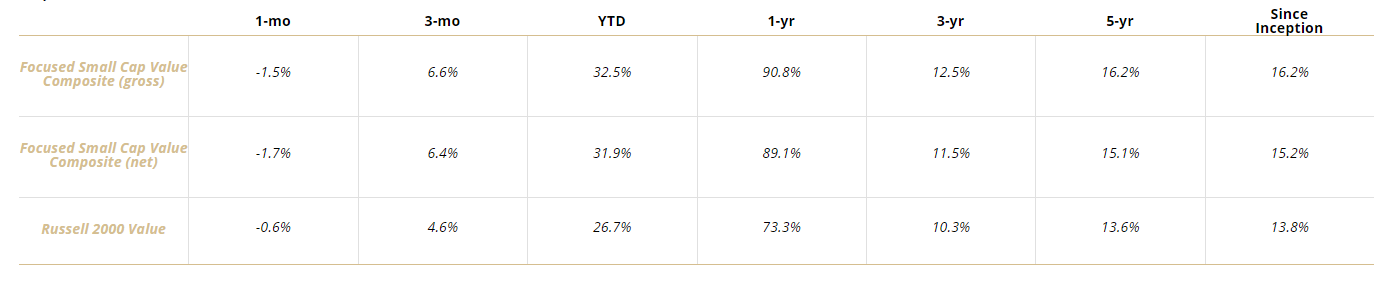
Performance - Average Annual Total Returns
as of 12/31/2022
1-mo
3-mo
YTD
1-yr
3-yr
5-yr
Since
Inception
Focused Small Cap Value Composite (gross)
-6.7%
14.9%
-10.2%
-10.2%
7.0%
4.2%
9.5%
Focused Small Cap Value Composite (net)
-6.8%
14.6%
-10.8%
-10.8%
6.1%
3.3%
8.5%
Russell 2000 Value
-6.6%
8.4%
-14.5%
-14.5%
4.7%
4.1%
8.2%
*Returns for periods less than one year are not annualized
Performance - Average Annual Total Returns
as of 6/30/21
*Returns for periods less than one year are not annualized
Returns for periods less than one year are not annualized
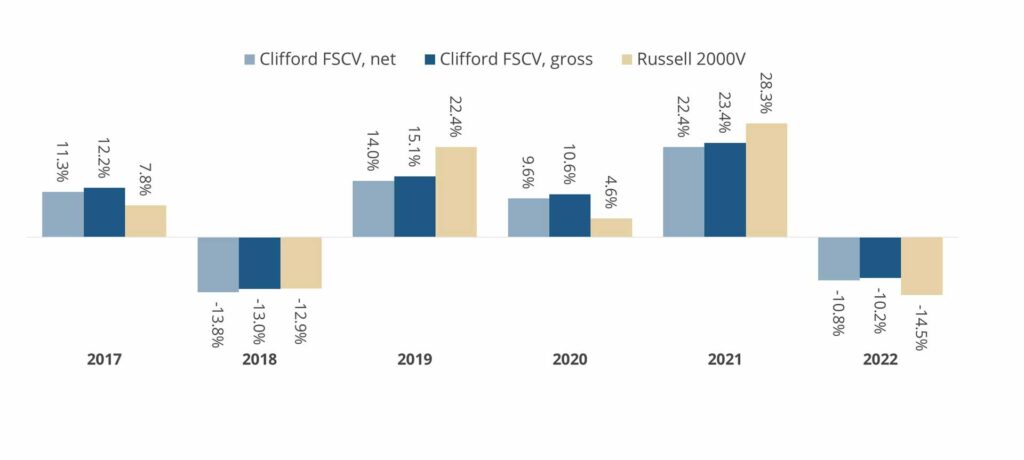
Calendar Year Returns
as of 12/31/22
Portfolio performance and statistics presented are the results of the Clifford Capital Focused Small Cap Value (“FSCV”) Composite. The FSCV Composite combines high-quality (Core Value) stock investments, opportunistic (Deep Value) stock investments and cash. The FSCV Strategy offers exposure to US Value equities of small sized companies (by market capitalization). The inception date for the FSCV Composite is April 1, 2016. Composite returns are shown after the deduction of transaction costs and include the reinvestment of all income including capital gains. Net of fees returns are calculated after the deduction of the actual advisory fees paid by clients. Gross of fees returns do not reflect the deduction of advisory fees. A client’s returns will be reduced by investment advisory fees and other expenses that may be incurred during account management.
The FSCV Composite’s benchmark is the Russell 2000 Value Total Return Index, which tracks the performance of small-capitalization U.S. equities that exhibit value characteristics. The benchmarks may have different composition, volatility, risk, investment philosophy, holding times, and/or other investment-related factors than the Composites. Therefore, an investor’s individual results may vary significantly from the benchmark’s performance. An index is unmanaged, does not incur fees or expenses, and cannot be invested in directly. Past performance is not indicative of future returns.

Characteristics
as of 6/30/21

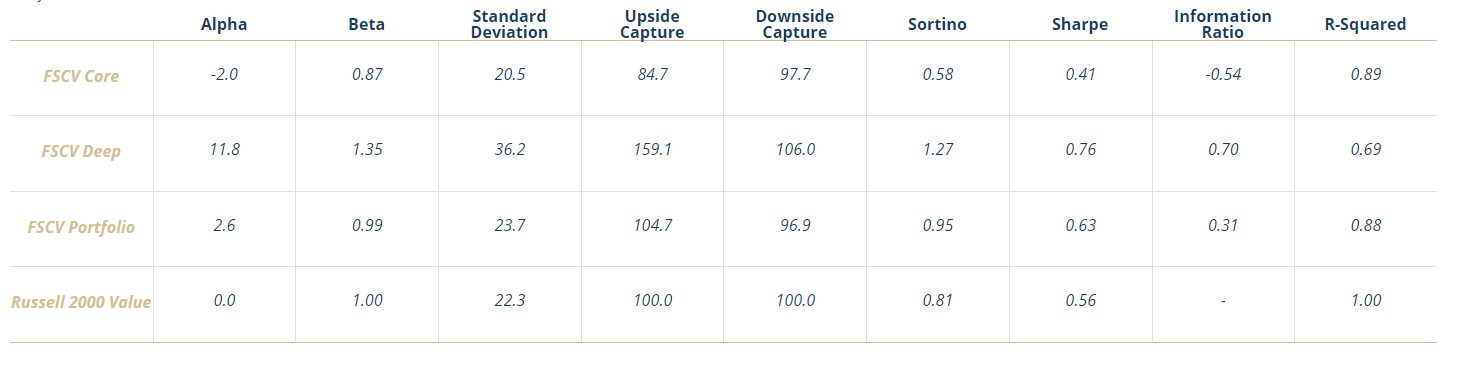
Performance Statistics
as of 12/31/2022 – 5 Year
Alpha
Beta
Standard Deviation
Upside
Capture
Downside
Capture
Sortino
Sharpe
Information
Ratio
R-Squared
FSCV Core
1.5
0.84
21.8
87.0
90.0
0.25
0.18
0.11
0.86
FSCV Deep
-1.0
1.40
39.0
131.1
118.9
0.01
0.00
-0.13
0.73
FSCV Portfolio
0.4
1.01
25.9
98.8
99.2
0.17
0.11
0.01
0.88
Russell 2000 Value
0.0
1.00
24.2
100.0
100.0
0.16
0.12
-
1.00
Statistics definitions found in “Important Disclosures Below.”
Characteristics
as of 12/31/2022
FSCV
R2000V
Number of Holdings
30
1383
Average Market Cap ($ Weighted)
$2.2B
$2.4B
Median Market Cap
$1.3B
$0.8B
Price / Earnings (trailing)
12.5
10.1
Price / Cash Flow
7.5
6.0
Price / Book
1.5
0.8
Turnover (LTM)
38.9%
n/a
Active Share
99%
0%
Top 10 Holdings
as of 9/30/2022
% of Net Assets
CVB Financial
4.7%
Winmark
4.6%
NextGen Healthcare
4.5%
Community Trust Bancorp
4.5%
Westamerica Bancorp
4.1%
First Hawaiian
4.0%
Hancock Whitney
3.8%
Perdoceo Education
3.7%
DXC Technology
3.7%
EVERTEC
3.5%
Top Ten Holdings only shows securities held and does not include any cash or cash equivalent positions in the portfolio. The holdings information presented is based on a representative portfolio and should not be considered a recommendation to purchase or sell any security. There is no assurance that any securities presented herein will remain in the portfolio at the time you receive information or that securities sold have not been repurchased. The securities discussed do not represent an account’s entire portfolio and in the aggregate may represent only a small percentage of an account’s portfolio holdings. It should not be assumed that any securities transactions or holdings presented were or will prove to be profitable, or that the investment recommendations or decisions we make in the future will be profitable or will equal the investment performance of the securities presented herein. Other portfolios will vary in composition, characteristics, and will experience different investment results.
Sector Allocation
as of 6/30/21
Sector
FSCV
R2000V
Financials
23.3%
25.3%
Information Technology
16.9%
5.5%
Consumer Discretionary
16.0%
8.3%
Industrials
15.3%
15.2%
Materials
7.5%
4.7%
Health Care
6.1%
11.4%
Communication Services
4.9%
4.5%
Consumer Staples
3.0%
2.8%
Energy
2.0%
6.6%
Real Estate
0.0%
11.1%
Utilities
0.0%
4.6%
Cash
5.0%
0.0%
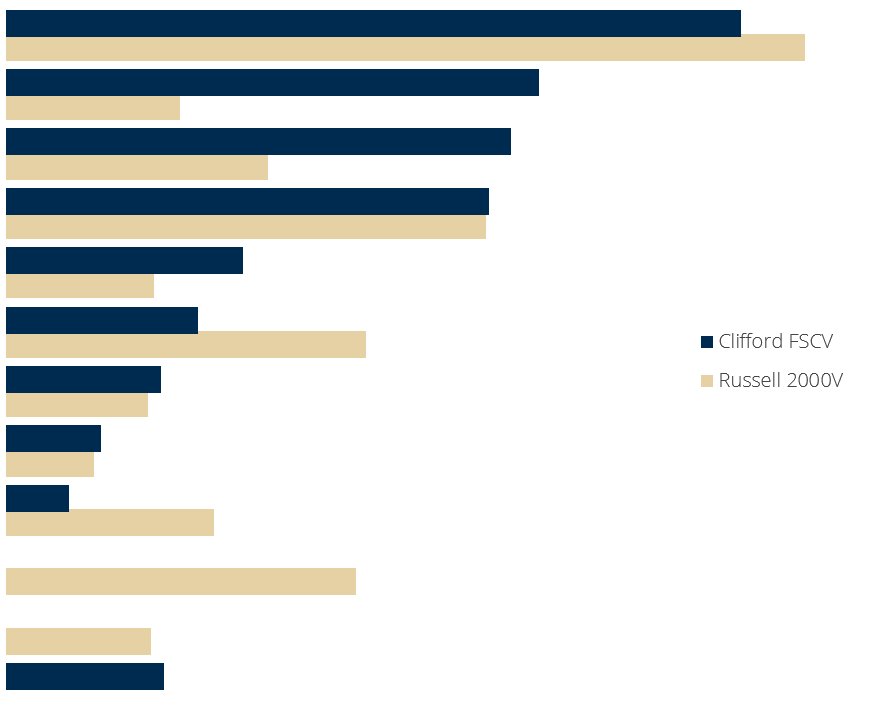
Sector Allocation
as of 12/31/2022
Weights are calculated as a percentage of net assets including cash & cash equivalents. Sector information is based on a representative account as of the date shown and subject to change.
