Partners Fund
Investor Class
TICKER: CLFFX
Fund Overview
OBJECTIVE
The investment objective of the Clifford Capital Partners Fund (the “Partners Fund”) is long-term capital appreciation.
HIGHLIGHTS
The blend of Core Value and Deep Value companies provides alpha potential with less volatility than a pure deep value strategy
- Core Value: high returns on capital, sustainable competitive advantages, and strong management teams
- Deep Value: negative market sentiment, defensible franchise value, and high expected return potential
INVESTMENT APPROACH
We use a bottom-up approach that seeks to identify businesses where expectations are irrationally low, leading to significant undervaluation, based on our independent research. At purchase both Core Value and Deep Value companies exhibit what we believe to be:
- Strong balance sheets
- Market overreaction short-term events
- Key Thesis Points™ (long-term catalysts) that will improve fundamentals
Primarily invests in US Large, Mid, and Small Cap companies at the time of purchase
Concentrated portfolio of 25-35 positions
Quick Look
as of 9/30/2024
Total Assets
(all share classes)
$124 mm
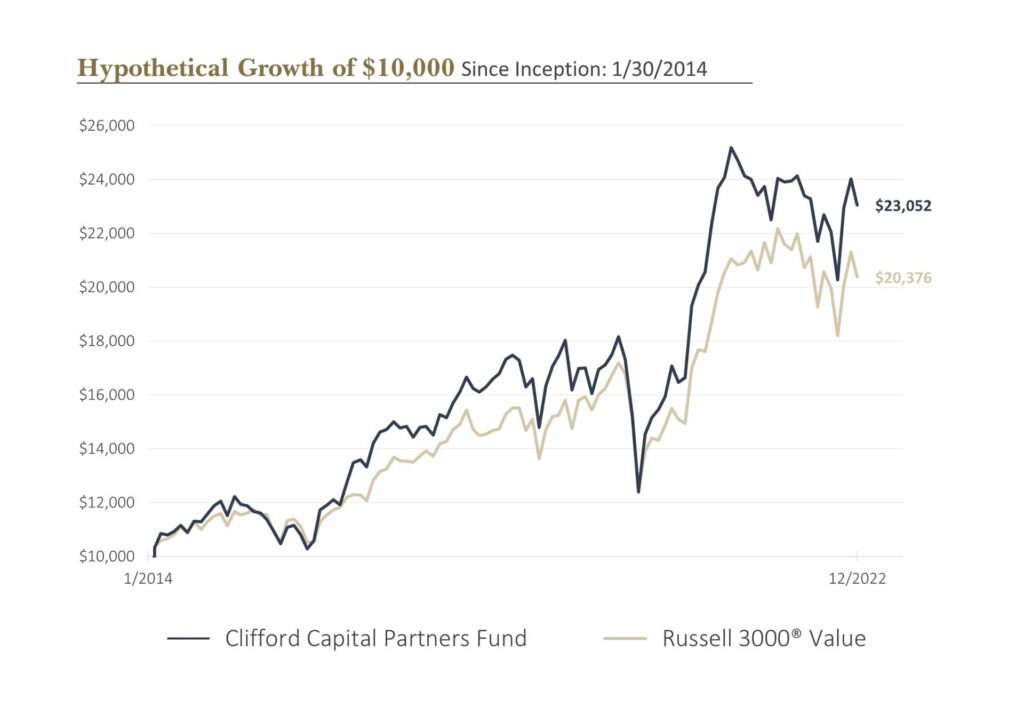
Inception Date
1/30/2014
CUSIP
98147A253
Primary Benchmark
Russell 3000 Value Index
Minimum Initial Investment
$2,500
Gross Expense Ratio
1.59%
Net Expense Ratio*
1.15%
Availability
Open
**Clifford Capital Partners, LLC (the Adviser) has contractually agreed to reduce fees and/or reimburse certain fund expenses until January 31, 2025.
Investment Team

Ryan Batchelor, CFA
PORTFOLIO MANAGER & CIO, PRINCIPAL

David Passey, CFA
RESEARCH ANALYST, PRINCIPAL

Matthew Davis
RESEARCH ASSOCIATE
Morningstar RatingTM,1
as of 9/30/2024
# of Stars - 2
# of funds - 375
Morningstar Category: Mid-Cap Value
The Overall Morningstar Rating, a weighted average of the three-, five-, and ten-year (if applicable) ratings, is out of 393 funds in the Mid-Cap Value category, based on risk-adjusted return as of December 31st 2022.
©2021 Morningstar. All Right Reserved. The information contained herein: (1) is proprietary to Morningstar and/or its content providers; (2) may not be copied or distributed; and (3) is not warranted to be accurate, complete or timely. Neither Morningstar not its content providers are responsible for any damages or losses arising from any use of this information. Past performance is no guarantee of future results.
1 The Morningstar RatingTM for funds, or “star rating”, is calculated for mutual funds with at least a three-year history. It is calculated based on a Morningstar Risk-Adjusted Return measure that accounts for variation in a fund’s monthly excess performance, placing more emphasis on downward variations and rewarding consistent performance. The top 10% of funds in each product category receive 5 stars, the next 22.5% receive 4 stars, the next 35% receive 3 stars, the next 22.5% receive 2 stars, and the bottom 10% receive 1 star. The Overall Morningstar Rating for a fund is derived from a weighted average of the performance figures associated with its three-, five-, and 10-year (if applicable) Morningstar Rating metrics. The Morningstar rating is for the Investor Class Only; other classes may have different performance characteristics.
Performance
Average Annual Total Returns
as of 9/30/2024
*Returns for periods of less than one year are not annualized.
Current performance may be lower or higher than the data quoted. Investment returns and principal value will fluctuate and shares, when redeemed, may be worth more or less than their original cost. To obtain the Fund’s performance current to the most recent month-end, please call 800.673.0550. A Fund’s performance, especially for short time periods, should not be the sole factor in making an investment decision.

Calendar Year Returns
as of 12/31/2023
No Data Found
Characteristics
as of 9/30/2024
CLFFX
R3000V
Number of Holdings
32
2310
Average Market Cap ($ Weighted)
$60.5 B
$163.5 B
Median Market Cap
$23.3 B
$2.2 B
Price / Earnings (trailing)
13.5
18.8
Price / Cash Flow
7.1
12.1
Price / Book
1.8
2.5
Turnover (LTM)
12.0%
n/a
Active Share
94%
0%
Top 10 Holdings
as of 9/30/2024
Company
CLFFX
Fidelity National
4.1%
Dolby Labs
4.0%
Vodafone
3.9%
RTX Corp.
3.8%
Pitney Bowes
3.8%
Solventum
3.8%
Glacier Bancorp.
3.6%
3M
3.6%
Kenvue
3.6%
NCR Atleos
3.5%
Portfolio holdings exclude cash and short-term investments. Cash represented 3.5% of the total portfolio. Current and future holdings are subject to change and risk. For a complete list of the Fund’s portfolio securities, call (800) 628-4077.
Performance Statistics
as of 9/30/2024 – 3 Year
Statistics definitions found in “Important Disclosures” below
Sector Allocation
as of 9/30/2024
No Data Found
Weights are calculated as a percentage of net assets including cash & cash equivalents. Sector information is based on a representative account as of the date shown and subject to change.
Commentary & Literature
Partners Fund Distributions – Investor Class
Important Disclosures
Investing in small or mid- cap funds can be more volatile and loss of principal could be greater than investing in large cap or more diversified funds.
Russell 3000® Value. The Russell 3000 Value Index measures the performance of those Russell 3000 Index companies with lower price-to-book ratios and lower forecasted growth characteristics. Russell Mid-Cap Value. The Russell Midcap® Value Index measures the performance of the midcap value segment of the US equity universe. It includes those Russell Midcap® Index companies with lower price-to-book ratios and lower forecasted growth values. Index Source: Bloomberg® and Russell® You cannot invest directly in any index.
Information about Risk
Risks of Investing in Equity Securities. Overall stock market risks may affect the value of the Fund. Factors such as domestic economic growth and market conditions, interest rate levels, and political events affect the securities markets. When the value of the Fund’s investments goes down, your investment in the Fund decreases in value and you could lose money.
Risks of Small-Cap and Mid-Cap Securities. Investing in the securities of small-cap and mid-cap companies generally involves substantially greater risk than investing in larger, more established companies.
Focused Investment Risk. The Fund is a focused fund and generally holds stocks of between only 25 and 35 companies. Focused funds may invest a larger portion of their assets in the securities of a single issuer compared to a more diversified fund. Focusing investments in a small number of companies may subject the Fund to greater share price volatility and therefore a greater risk of loss because a single security’s increase or decrease in value may have a greater impact on the Fund’s value and total return.
Sector Risk. The Fund may emphasize investment in one or more particular business sectors at times, which may cause the value of its share price to be more susceptible to the financial, market, or economic events affecting issuers and industries within those sectors than a fund that does not emphasize investment in particular sectors.
Management Style Risk. Because the Fund invests primarily in value stocks (stocks that the Adviser believes are undervalued), the Fund’s performance may at times be better or worse than the performance of stock funds that focus on other types of stock strategies (e.g., growth stocks), or that have a broader investment style.
Data shown, such as portfolio holdings, percentages, and sector weightings, generally applied on the date shown, and may have changed substantially since then. References to specific securities and sectors are not recommendations to buy or sell such securities or related investments.
Sector and Industry classifications as determined by the Fund may reference data from sources such as Bloomberg or the Global Industry Classification Codes (GICS) developed by Standard & Poor’s and Morgan Stanley Capital International. Sector weights are a percent of equity investment and subject to change.
Fund Characteristics
P/E Ratio (trailing): Sum of stock prices of the fund’s holdings divided by the aggregate earnings per share of those holdings for the past 12 months, calculated as a weighted harmonic average. Price/Book Ratio: weighted average of the stocks’ price divided by book value per share. Book value per share is defined as common equity, including intangibles, divided by shares outstanding times the adjustment factor. Price/Cash Flow Ratio: a ratio used to compare a company’s market value to its cash flow. It is calculated by dividing the company’s market cap by the company’ operating cash flow in the most recent fiscal year (or the most recent four fiscal quarters); or, equivalently, divide the per-share stock price by the per-share operating cash flow. Weighted Average Market Cap: Average market capitalization of companies held by the fund, weighted by their percentage of fund net assets. Portfolio Turnover: A measure of trading activity in a fund’s portfolio over the past 12 months expressed as a percentage of the fund’s average total assets. Market Cap is the aggregate value of all of a company’s outstanding equity securities. Dividend Yield: a financial ratio (dividend/price) that shows how much a company pays out in dividends each year relative to its stock price. Active Share is a measure of the percentage of stock holdings in a manager’s portfolio that differs from the benchmark index.
Performance Statistics
Alpha measures a fund’s risk/reward potential. A positive alpha means the fund outperformed the index. A negative alpha means the fund underperformed the index. Beta measures a fund’s risk in relation to the market. A beta of 0.8 means the fund’s total return is likely to move up or down 80% of the market change; 1.25 means total return is likely to move up or down 25% more than the market. R-Squared measures (from 0 to 1.0) how closely a fund’s movements are correlated with movements of its benchmark. An R-squared of 1.0 would mean that the fund’s movements are completely correlated with the movements of its benchmark. Standard Deviation measures the degree to which a fund’s performance has varied from its average performance over a particular time period. The greater the standard deviation, the greater a fund’s volatility (risk). Upside Capture explains how well a fund performs in time periods where the benchmark’s returns are greater than zero. Downside Capture explains how well a fund performs in time periods where the benchmark’s returns are less than zero. Sharpe Ratio calculates the amount of fund return in excess of the risk-free rate per unit of risk (standard deviation) taken by the fund. Sortino Ratio calculates the amount of fund return received in excess of the risk-free interest rate per unit of “downside” risk (standard deviation of negative returns) taken by the fund. Information Ratio is used to evaluate the skill of a portfolio manager at generating returns in excess of a given benchmark. A higher information ratio result implies a better portfolio manager who’s achieving a higher return in excess of the benchmark, given the risk taken.
The Clifford Capital Partners Funds are distributed by ACA Foreside Fund Services, LLC., Portland, ME. Member FINRA/SIPC
